
Integral-LIS - MTO AIMS
LIS
Test Data
Tasks
Utilities
Administration
Common Components
LIS
Test Data
Tasks
Utilities
Administration
Common Components

The Reporting Package is used to build, view, and export reports. Any user with access to the Reports Module, will be able to generate on-the-fly reports.
Summary
The tutorials in this section provide detailed instructions on how to create reports of different types with the Report Designer. There are two ways to create a report. One is to via the Reports home page in the Reports package. The other way is via an LIS package. Every LIS package has an associated Reports module. This is the preferred method, as it only lists data sets that are relevant to the currently opened package. In the following procedure, the Plot and Plan Registry package is used as an example.
Report types covered include:
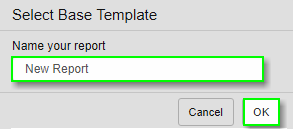
To design a generic report:
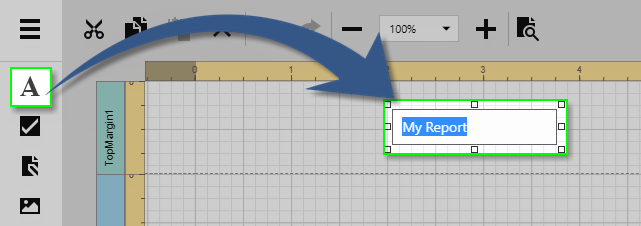
The Design Surface displays a report that is being edited in the 'Report Designer'.

The Design Surface includes the following principal elements.
* Rulers * Band Captions * In-Place Editor
The horizontal and vertical rulers display tickmarks in the measure units specified for your report. Click an element to evaluate its size and location using the rulers.
The horizontal ruler also allows you to modify report side margins by moving the left and right sliders on the ruler.

The vertical ruler shows resizing rectangles for every report band, which you can move to change the band height.

| Shrinking a band's width or height, such that it impedes the data fields, could cause the data to be unreadable in the report's final output. |
In the Report Designer, each report band carries a caption, the tab title and color, which depends on the band kind. These captions are not printed in the resultant report document and are only visible at design time.
| You can expand or collapse band content at design time, by clicking the tab at the left side of the band. To access the properties of a band, select the band by clicking anywhere in that band, and then switch to the Properties Panel. Refer to Section “Properties Panel” on page 1 for more information. |

The In-Place Editor allows you to edit the content of a text-oriented control (XRBarCode, XRCheckBox, XRLabel, XRRichText, or XRZipCode) by double-clicking it. Refer to Section “Toolbox” on page 1 for more information.

'Note:' The current Web Report Designer version does not support the in-place editing of rich text in the XRRichText control. Only the plain text editor is available for this report control.
To toggle between the Design and Preview mode of a report, use the corresponding buttons of the Main Toolbar.
The Field List panel enables the exploration and management of report data sources and parameters.

The Field List panel consists of the following sections.
* Manage Report Data Sources * Manage Report Parameters
The Field List lists available report data sources and displays their structure. Dragging a field from the Field List onto the Design Surface creates a new Label bound to that data field.

The following actions are available in the Field List for data source customization. To make these buttons (actions) visible, left-click the view in the Field List.

| Button | Description |
|---|---|
 | Removes the selected data source. |
 | Adds a new calculated field to the data source. |
 | Edits the current data source. |
To access the collection of report parameters, (A) expand the Parameters category in the Field List. To add a new parameter, (B) click the “+” icon.

The following actions are available for parameter customization.
| Button | Description |
|---|---|
 | Creates a new report parameter. |
| Removes the selected parameter. Make this button visible by clicking a parameter. |
| Enables customization of the selected parameter. Make this button visible by clicking a parameter. |
These are users who use specific modules and forms for a specific business process. They may not know all the systems but only components that are related to their area of responsibility. Each course is organized by specific business processes and will include one or more modules in each course. The training courses will cover relevant module(s) and inter-module workflows and how they relate to specific business processes.
CKGE_TMP_i Power Users CKGE_TMP_i
This is the first group that should be trained. Powers users are individuals who will learn all aspects of the system (all modules and forms) and can be used to train other staff in the future. ENKON will undertake “Train the Trainer” sessions with this group. The sessions will be a little longer than the General User training as additional functionality is included for this group as compared to the General Users.